The housing market in Western New York has seen significant shifts between 2018 and 2022, as reflected in the latest findings from the American Community Survey (ACS) 5-Year study (Compared with the study from 2018). From rapidly increasing home values to fluctuating vacant housing units, these changes offer a snapshot of how various regional towns and cities are evolving. While some areas have experienced sharp rises in home values and owner costs, others have seen stagnation or even declines in housing development. This report delves into the key trends driving these changes, providing insight into the housing market’s overall health and what it means for residents and potential homebuyers.
Data Note
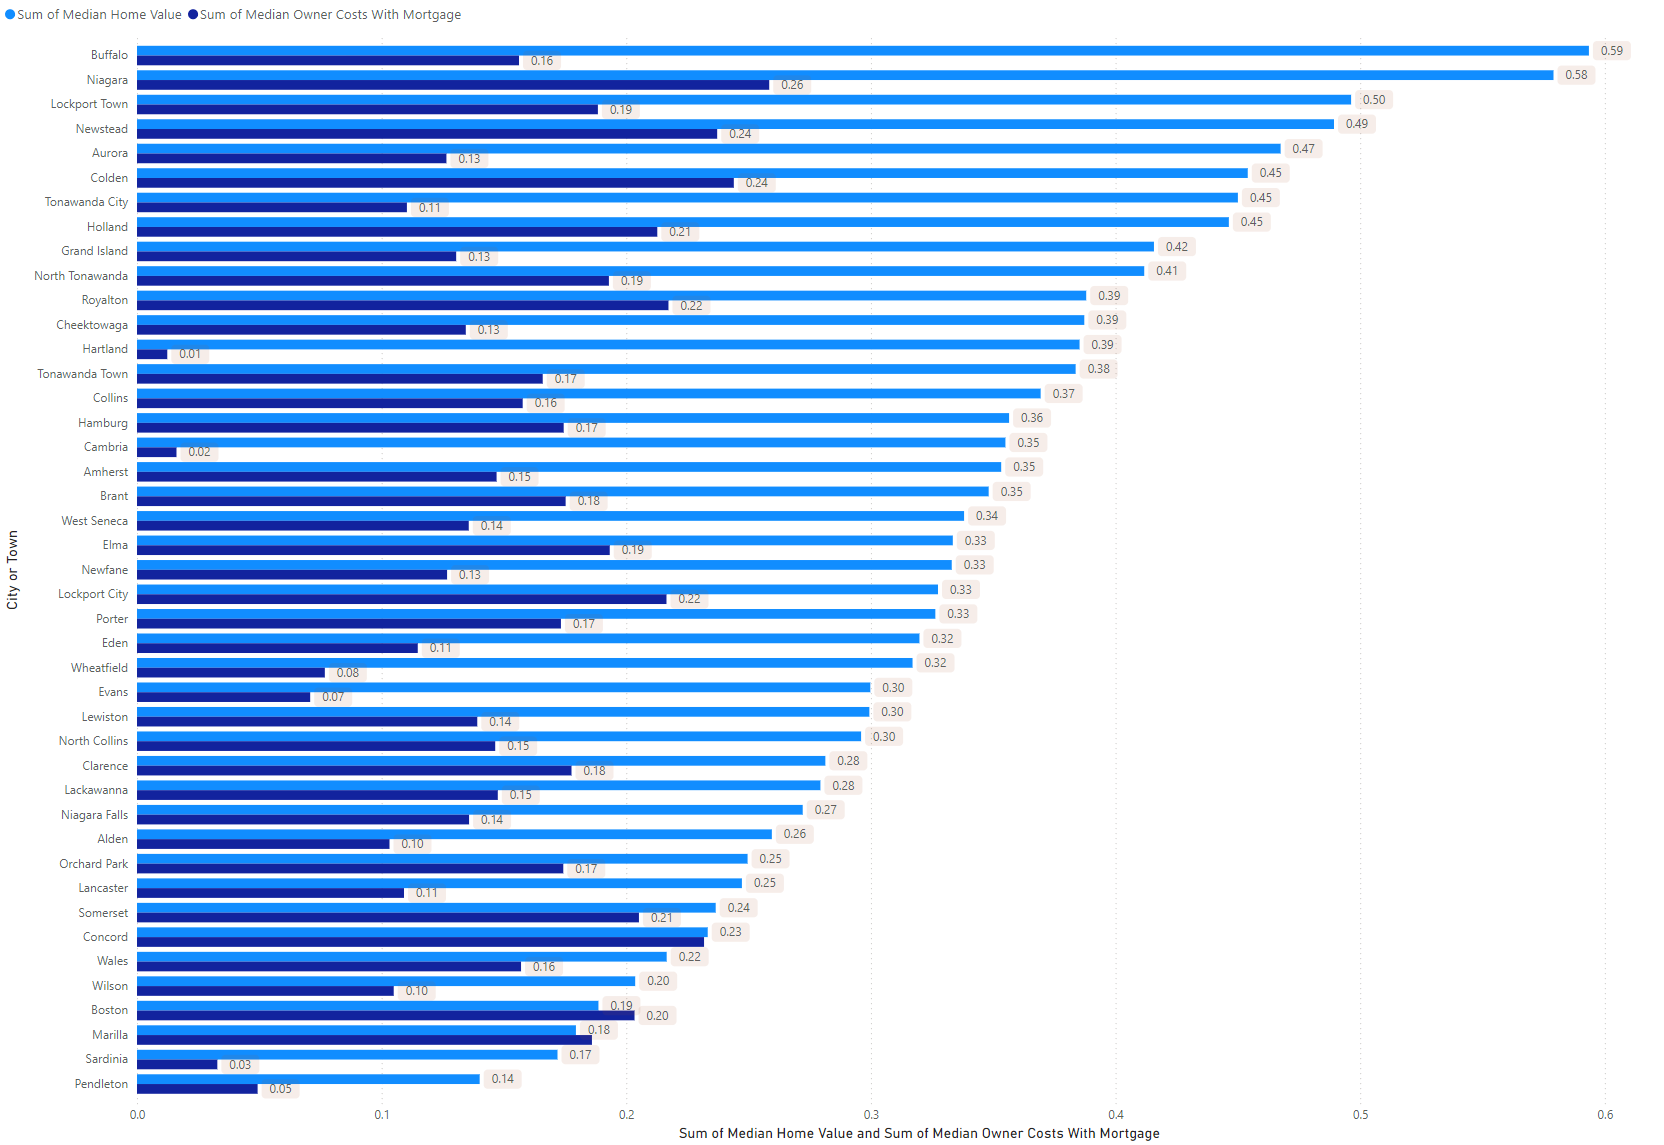
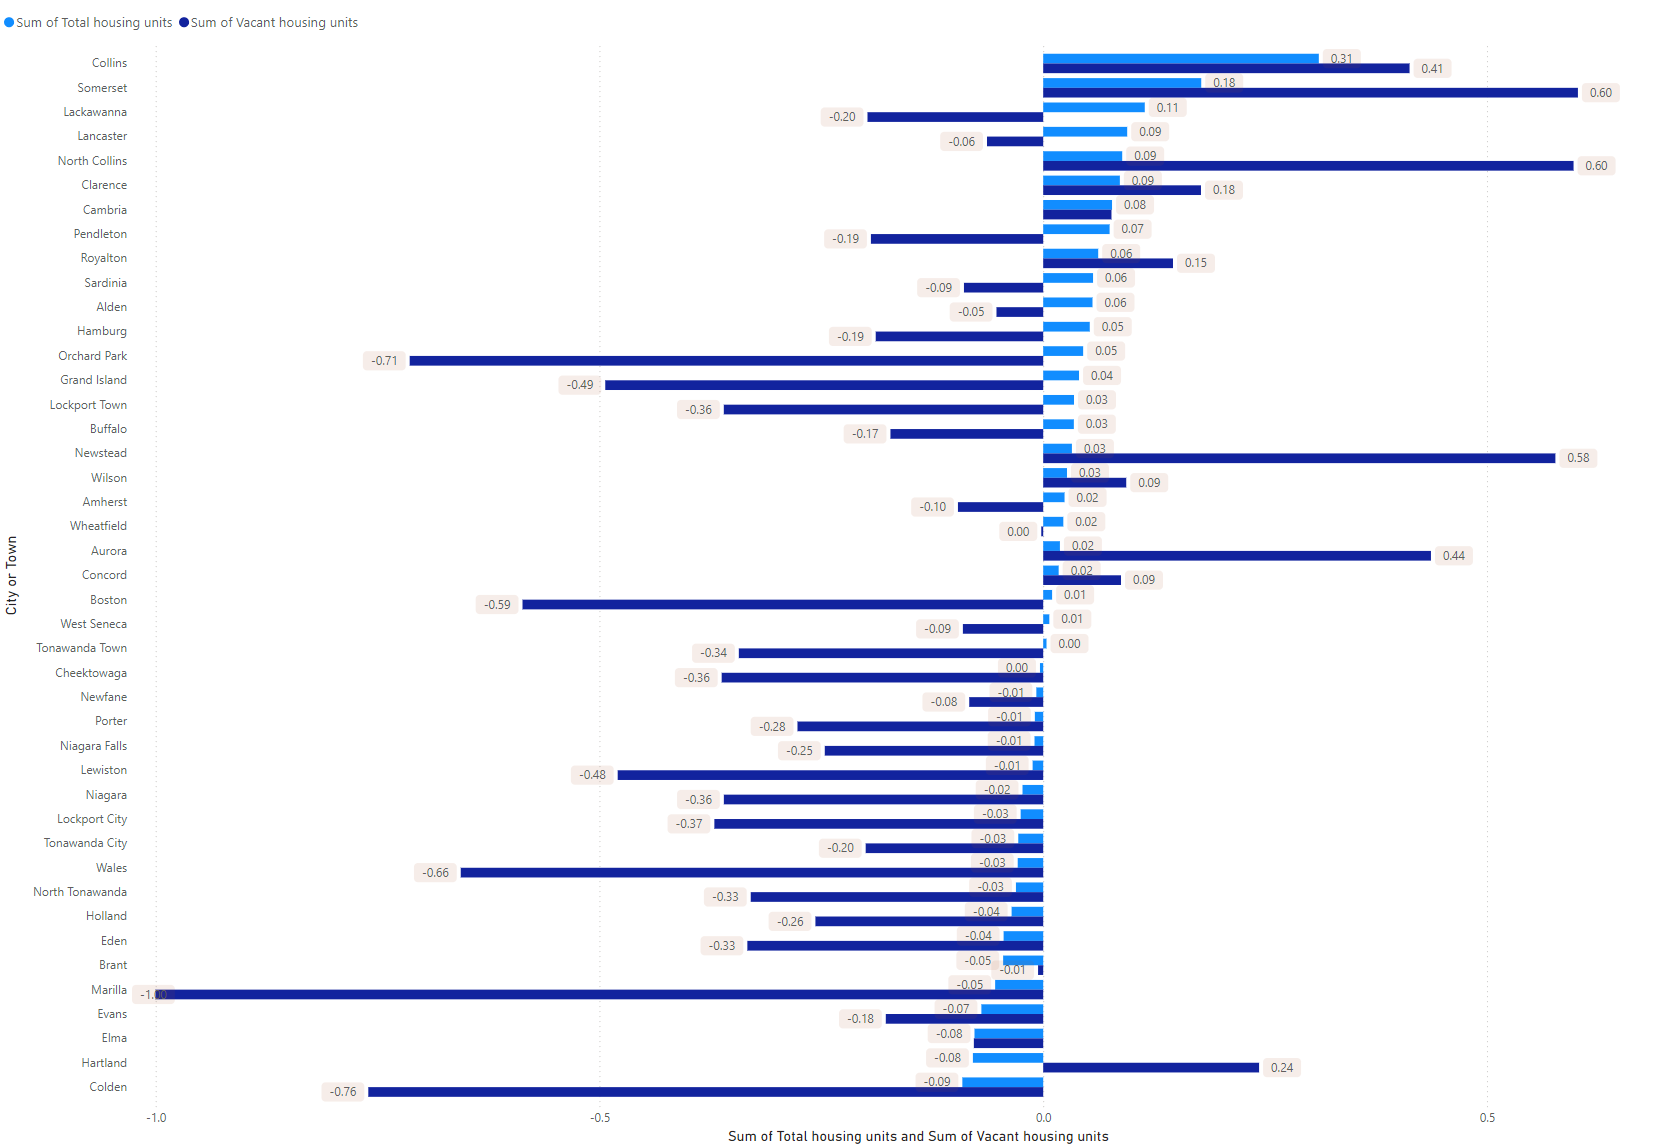
Numbers next to the bar represent percentage changes from a 2018 5-year and the 2022 5-year ACS study.
This data is a comparison of the 5 year ACS study from 2018 and the 5 year ACS study from 2022.
Percent Change Home Value Increase and Owner Cost Increase
Key insights:
- Buffalo experienced the highest percentage increase in median home value (59%) and median owner costs with a mortgage (16%).
- Niagara follows closely, with a significant 58% increase in home value and a 26% rise in owner costs.
- Lockport Town, Newstead, and Aurora also show considerable growth, with home value increases from 47% to 50%.
- In many cities and towns, the growth in home values significantly outpaces the increase in owner costs with a mortgage, which indicates that housing values have risen faster than mortgage-related costs.
- Lower increases in owner costs suggest that while home prices rose, other financial factors like interest rates or refinancing may have moderated the cost of homeownership.
Percentage Change in Total and Vacant Housing Units
Key insights:
- Orchard Park saw a sharp decline in total housing units (-0.71%) alongside a slight reduction in vacant housing units, indicating a decrease in housing development or population decline.
- Boston and Wales also experienced notable drops in total housing units (-0.59% and -0.66%, respectively).
- Hamburg showed one of the more significant increases in vacant housing units (0.41%) despite a minimal change in total housing units, possibly signaling higher vacancy rates or underutilized housing.
- Conversely, Niagara Falls and Grand Island saw substantial positive changes in vacant housing units, indicating increased availability.
- Some towns, such as Clarence and Wilson, showed positive growth in total and vacant housing, which may suggest expansion but also a risk of oversupply or under-occupied units.
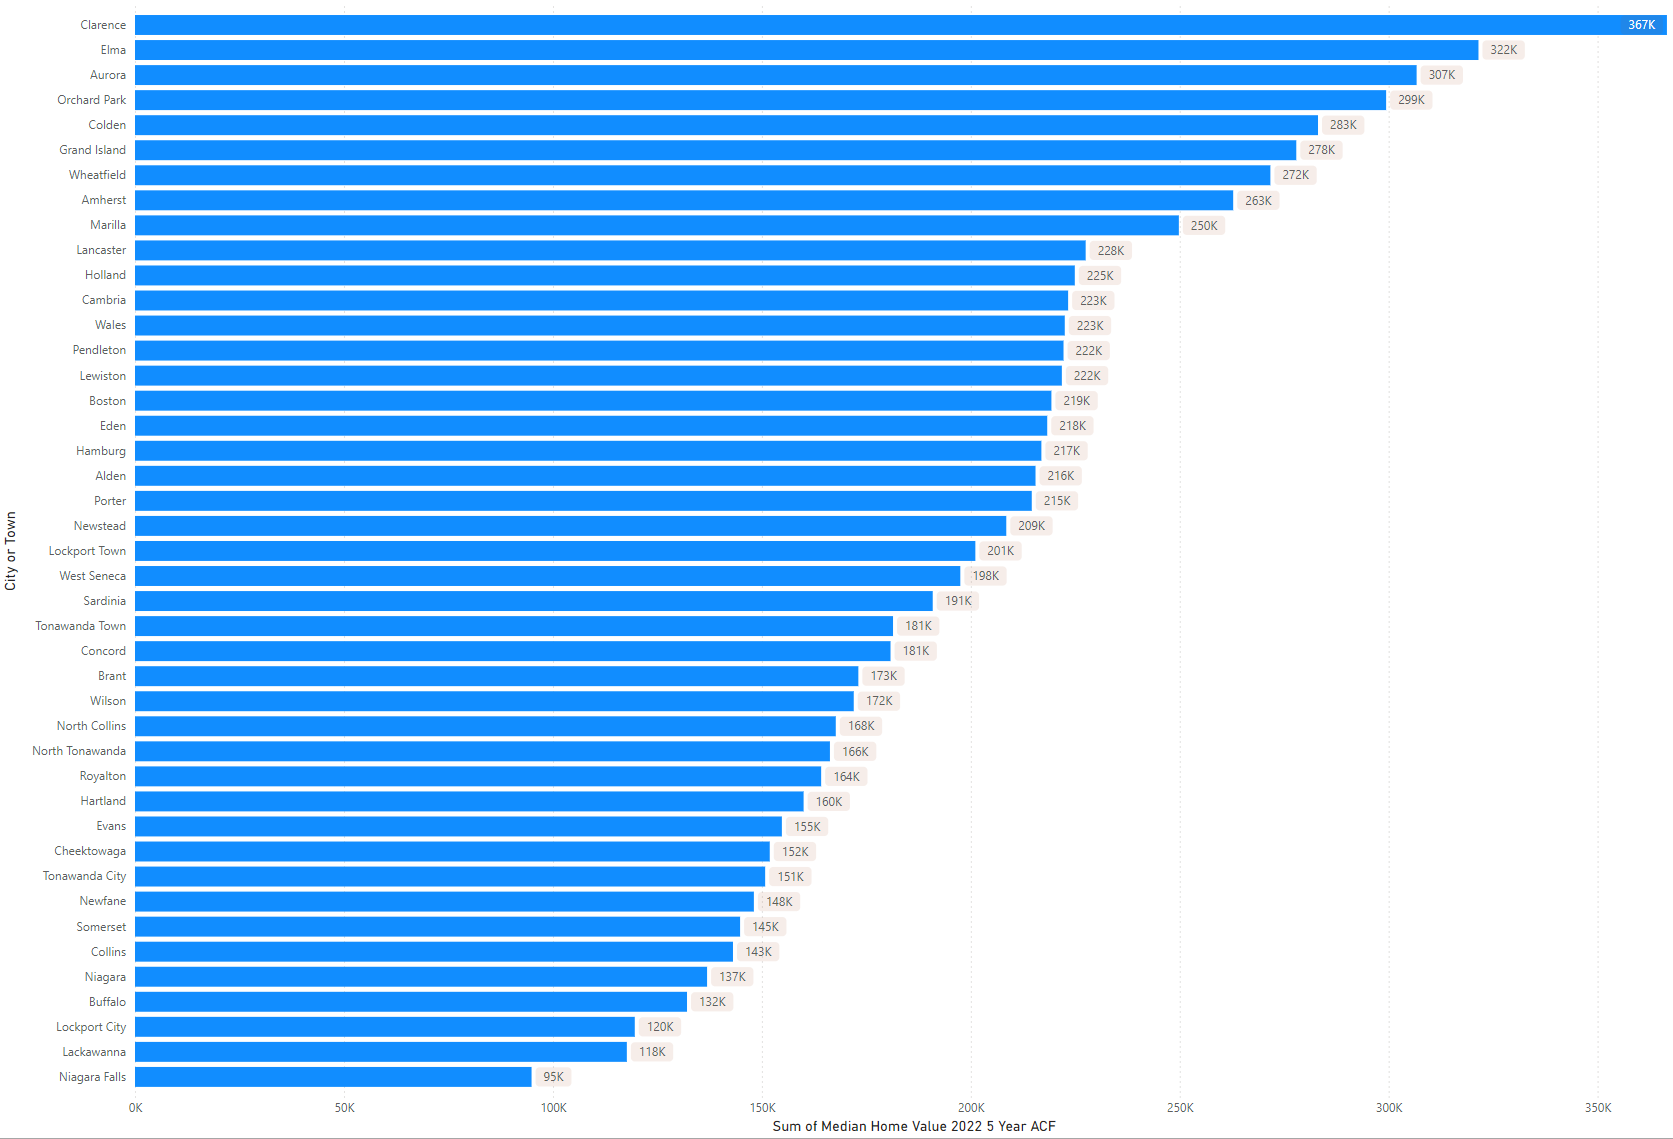
Median Home Value (2022)
Key insights:
- Clarence had the highest median home value in 2022 at $367K, followed by Elma ($322K) and Aurora ($307K).
- In contrast, cities like Niagara Falls ($95K), Lackawanna ($118K), and Buffalo ($132K) showed relatively low median home values, indicating significant disparities in housing market values across the region.
- Towns in the middle range, like Amherst and Lancaster, had median home values between $215K and $228K, showing stable growth but less extreme market conditions than high-end areas like Clarence or Orchard Park.
- Areas like Niagara Falls and Buffalo remain some of the more affordable regions for homebuyers, which may indicate different economic or market dynamics compared to the more affluent suburbs.
General Observations:
- Housing Affordability: While home values increased sharply in many areas, owner costs didn’t rise proportionally, suggesting that many homeowners may have benefited from refinancing or low mortgage rates during this period.
- Vacancy Trends: The shifts in vacant housing units could reflect migration patterns, economic shifts, or the availability of new developments, which vary widely across towns and cities.
- Disparities: There’s a stark contrast in regional housing markets, with some areas experiencing rapid home value appreciation. In contrast, others remain affordable, possibly reflecting varying local economies or population growth.
This analysis reveals both positive trends in housing growth and emerging challenges regarding vacancies and affordability across different towns and cities.
Data Source:
U.S. Census Bureau. “Financial Characteristics.” American Community Survey, ACS 5-Year Estimates Subject Tables, Table S2503, 2022, https://data.census.gov/table/ACSST5Y2022.S2503?t=Business and Owner Characteristics&g=050XX00US36029$0600000,36063$0600000&moe=false. Accessed on August 19, 2024.
U.S. Census Bureau. “Median Selected Monthly Owner Costs (Dollars) by Mortgage Status.” American Community Survey, ACS 5-Year Estimates Detailed Tables, Table B25088, 2022, https://data.census.gov/table/ACSDT5Y2022.B25088?t=Business and Economy&g=050XX00US36029$0600000,36063$0600000. Accessed on August 13, 2024.

