In the era of big data, transforming raw numbers into actionable insights is essential for businesses and professionals. This process reveals new opportunities and enhances decision-making, driving growth and success in a competitive landscape. Data visualization tools are crucial in connecting complex data with actionable insights. This article explores four popular data visualization tools—Excel, Zoho Analytics, Power BI, and Domo—highlighting their advantages and disadvantages and providing guidance on when to use each.
Microsoft Excel
Pros:
- Familiarity and Accessibility: Widely used and understood, making it easy for teams to adopt.
- Versatile Functionality: Basic to advanced chart types, pivot tables, and conditional formatting are offered.
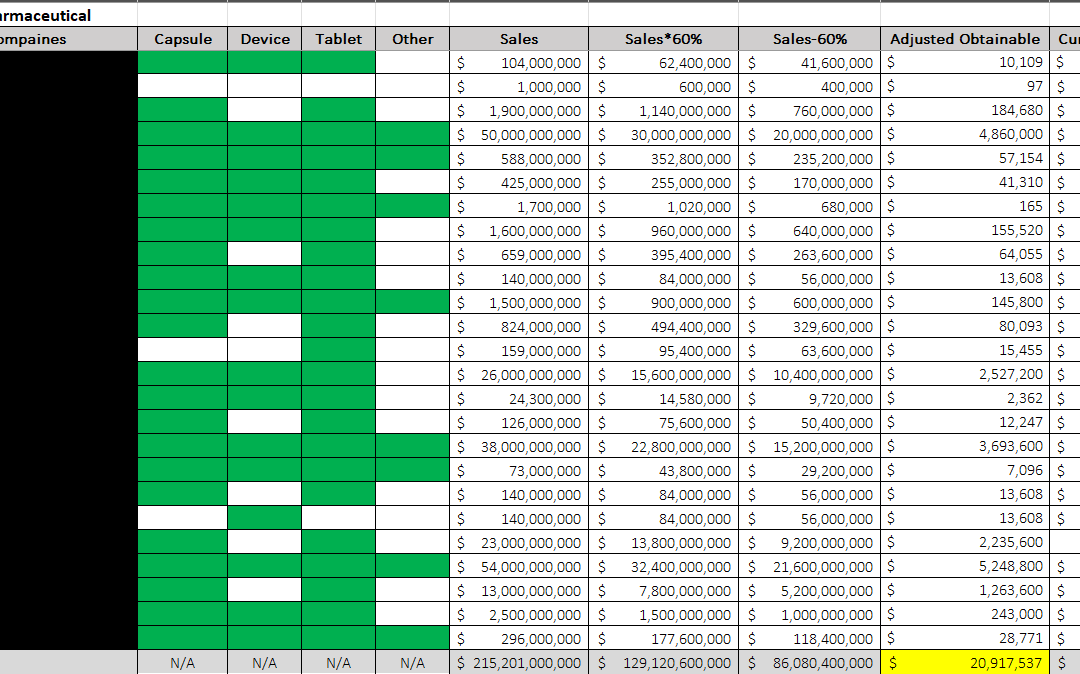
- Data Manipulation: Strong data cleaning, analysis, and manipulation capabilities within spreadsheets.
- Integration: Seamlessly integrates with other Microsoft Office applications and supports various data formats.
Cons:
- Limited Scalability: Performance may decline with massive datasets (typically over 1 million rows).
- Basic Visualizations: Lacks some advanced visualization features found in specialized tools.
- Collaboration Challenges: Real-time collaboration is less efficient compared to cloud-based platforms.
Best Used When:
- Working with small to medium-sized datasets.
- Quick analysis and visualization are needed without advanced features.
- Users prefer a familiar interface with a minimal learning curve.
- Integration with other Microsoft Office tools is required.
Zoho Analytics
Pros:
- Cloud-Based Platform: Accessible from anywhere, promoting remote collaboration.
- User-Friendly Interface: Intuitive drag-and-drop functionality for creating reports and dashboards.
- Data Connectivity: Connects with various data sources, including databases, cloud drives, and third-party apps.
- Collaboration Tools: Allows sharing of reports and dashboards with team members and clients.
Cons:
- Customization Limitations: It may offer fewer advanced customization options than other BI tools.
- Subscription Costs: A paid plan for full features is required, which can be added for larger teams.
- Learning Curve: Users may need time to explore all features and capabilities.
Best Used When:
- Small to medium-sized businesses need an affordable BI solution.
- Teams require a cloud-based tool for easy access and collaboration.
- Integrating data from multiple sources, especially within the Zoho ecosystem.
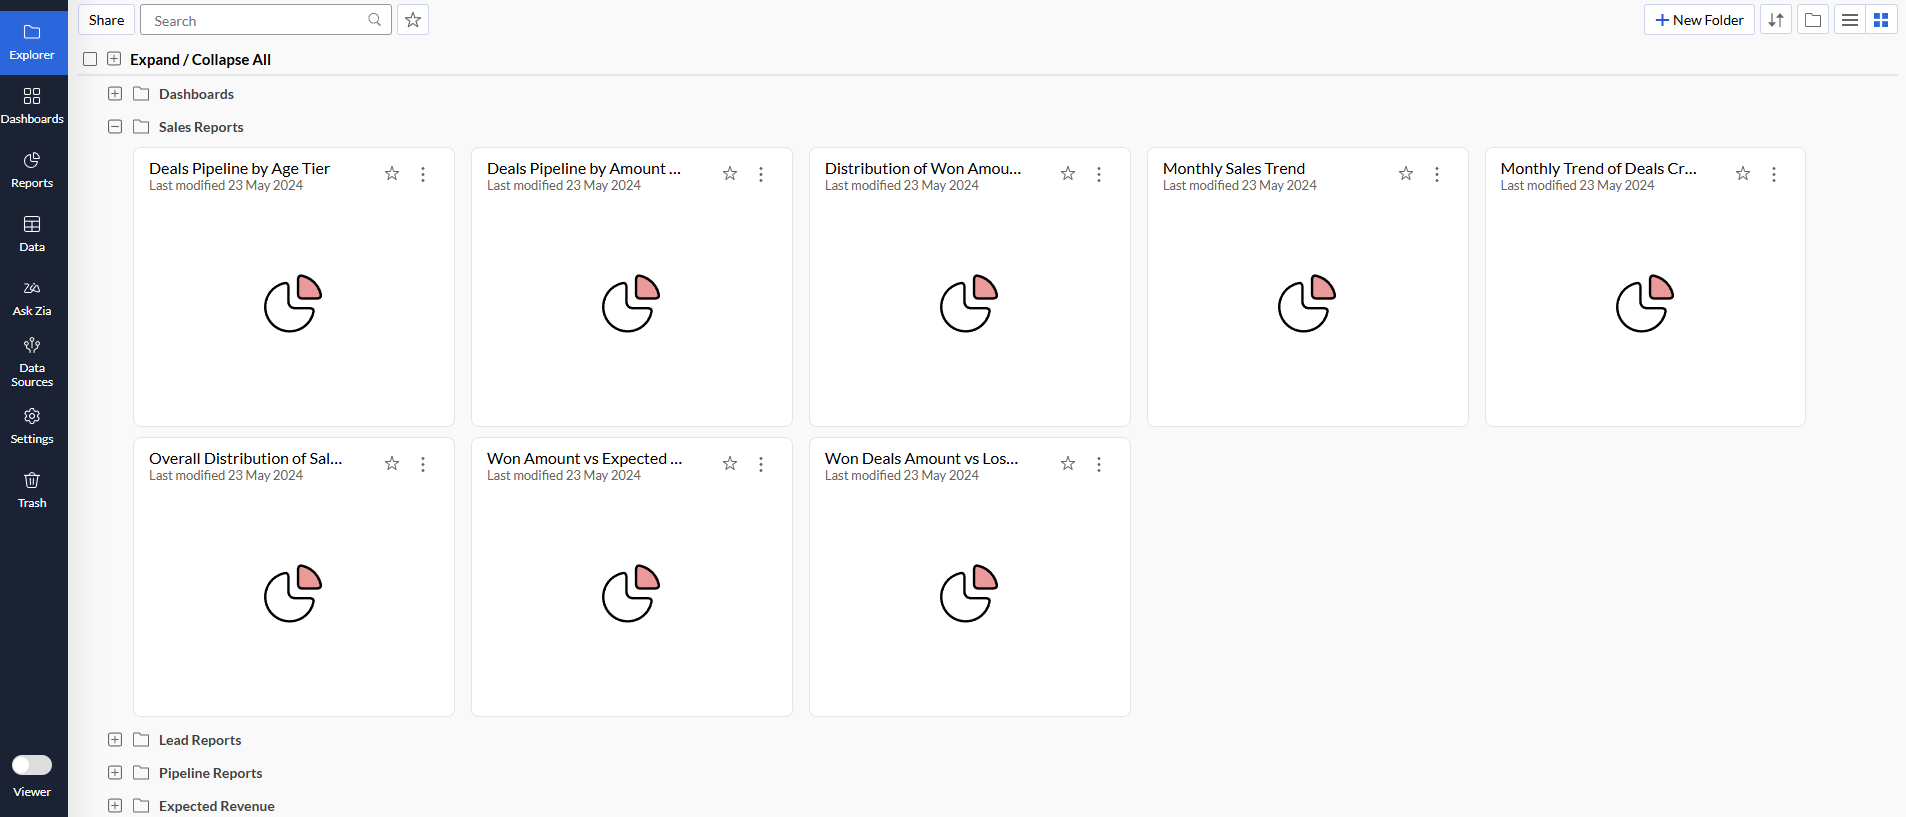
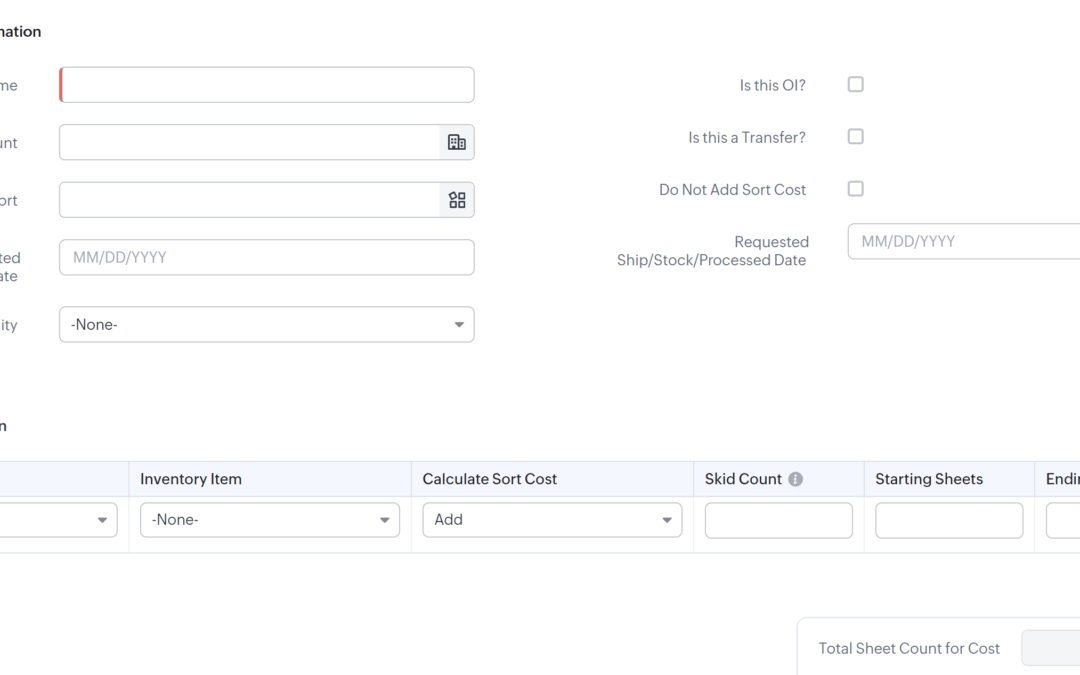
Zoho Analytics is probably the most straight forward option after Excel
Microsoft Power BI
Pros:
- Advanced Visualizations: Offers a rich set of interactive and customizable visualizations.
- Data Handling: Efficiently processes large volumes of data.
- Integration Capabilities: Connects seamlessly with various data sources, including Azure, Excel, and SQL databases.
- AI and Machine Learning: Incorporates AI features for data modeling and natural language queries.
Cons:
- Steeper Learning Curve: This may be complex for beginners unfamiliar with BI tools.
- Cost for Pro Features: Advanced functionalities require a Power BI Pro license.
- System Requirements: Desktop applications may need a robust system for optimal performance.
Best Used When:
- Organizations deal with large and complex datasets.
- Advanced analytics and real-time data monitoring are necessary.
- Businesses are already invested in the Microsoft ecosystem.
- Teams can allocate time for training to leverage advanced features.
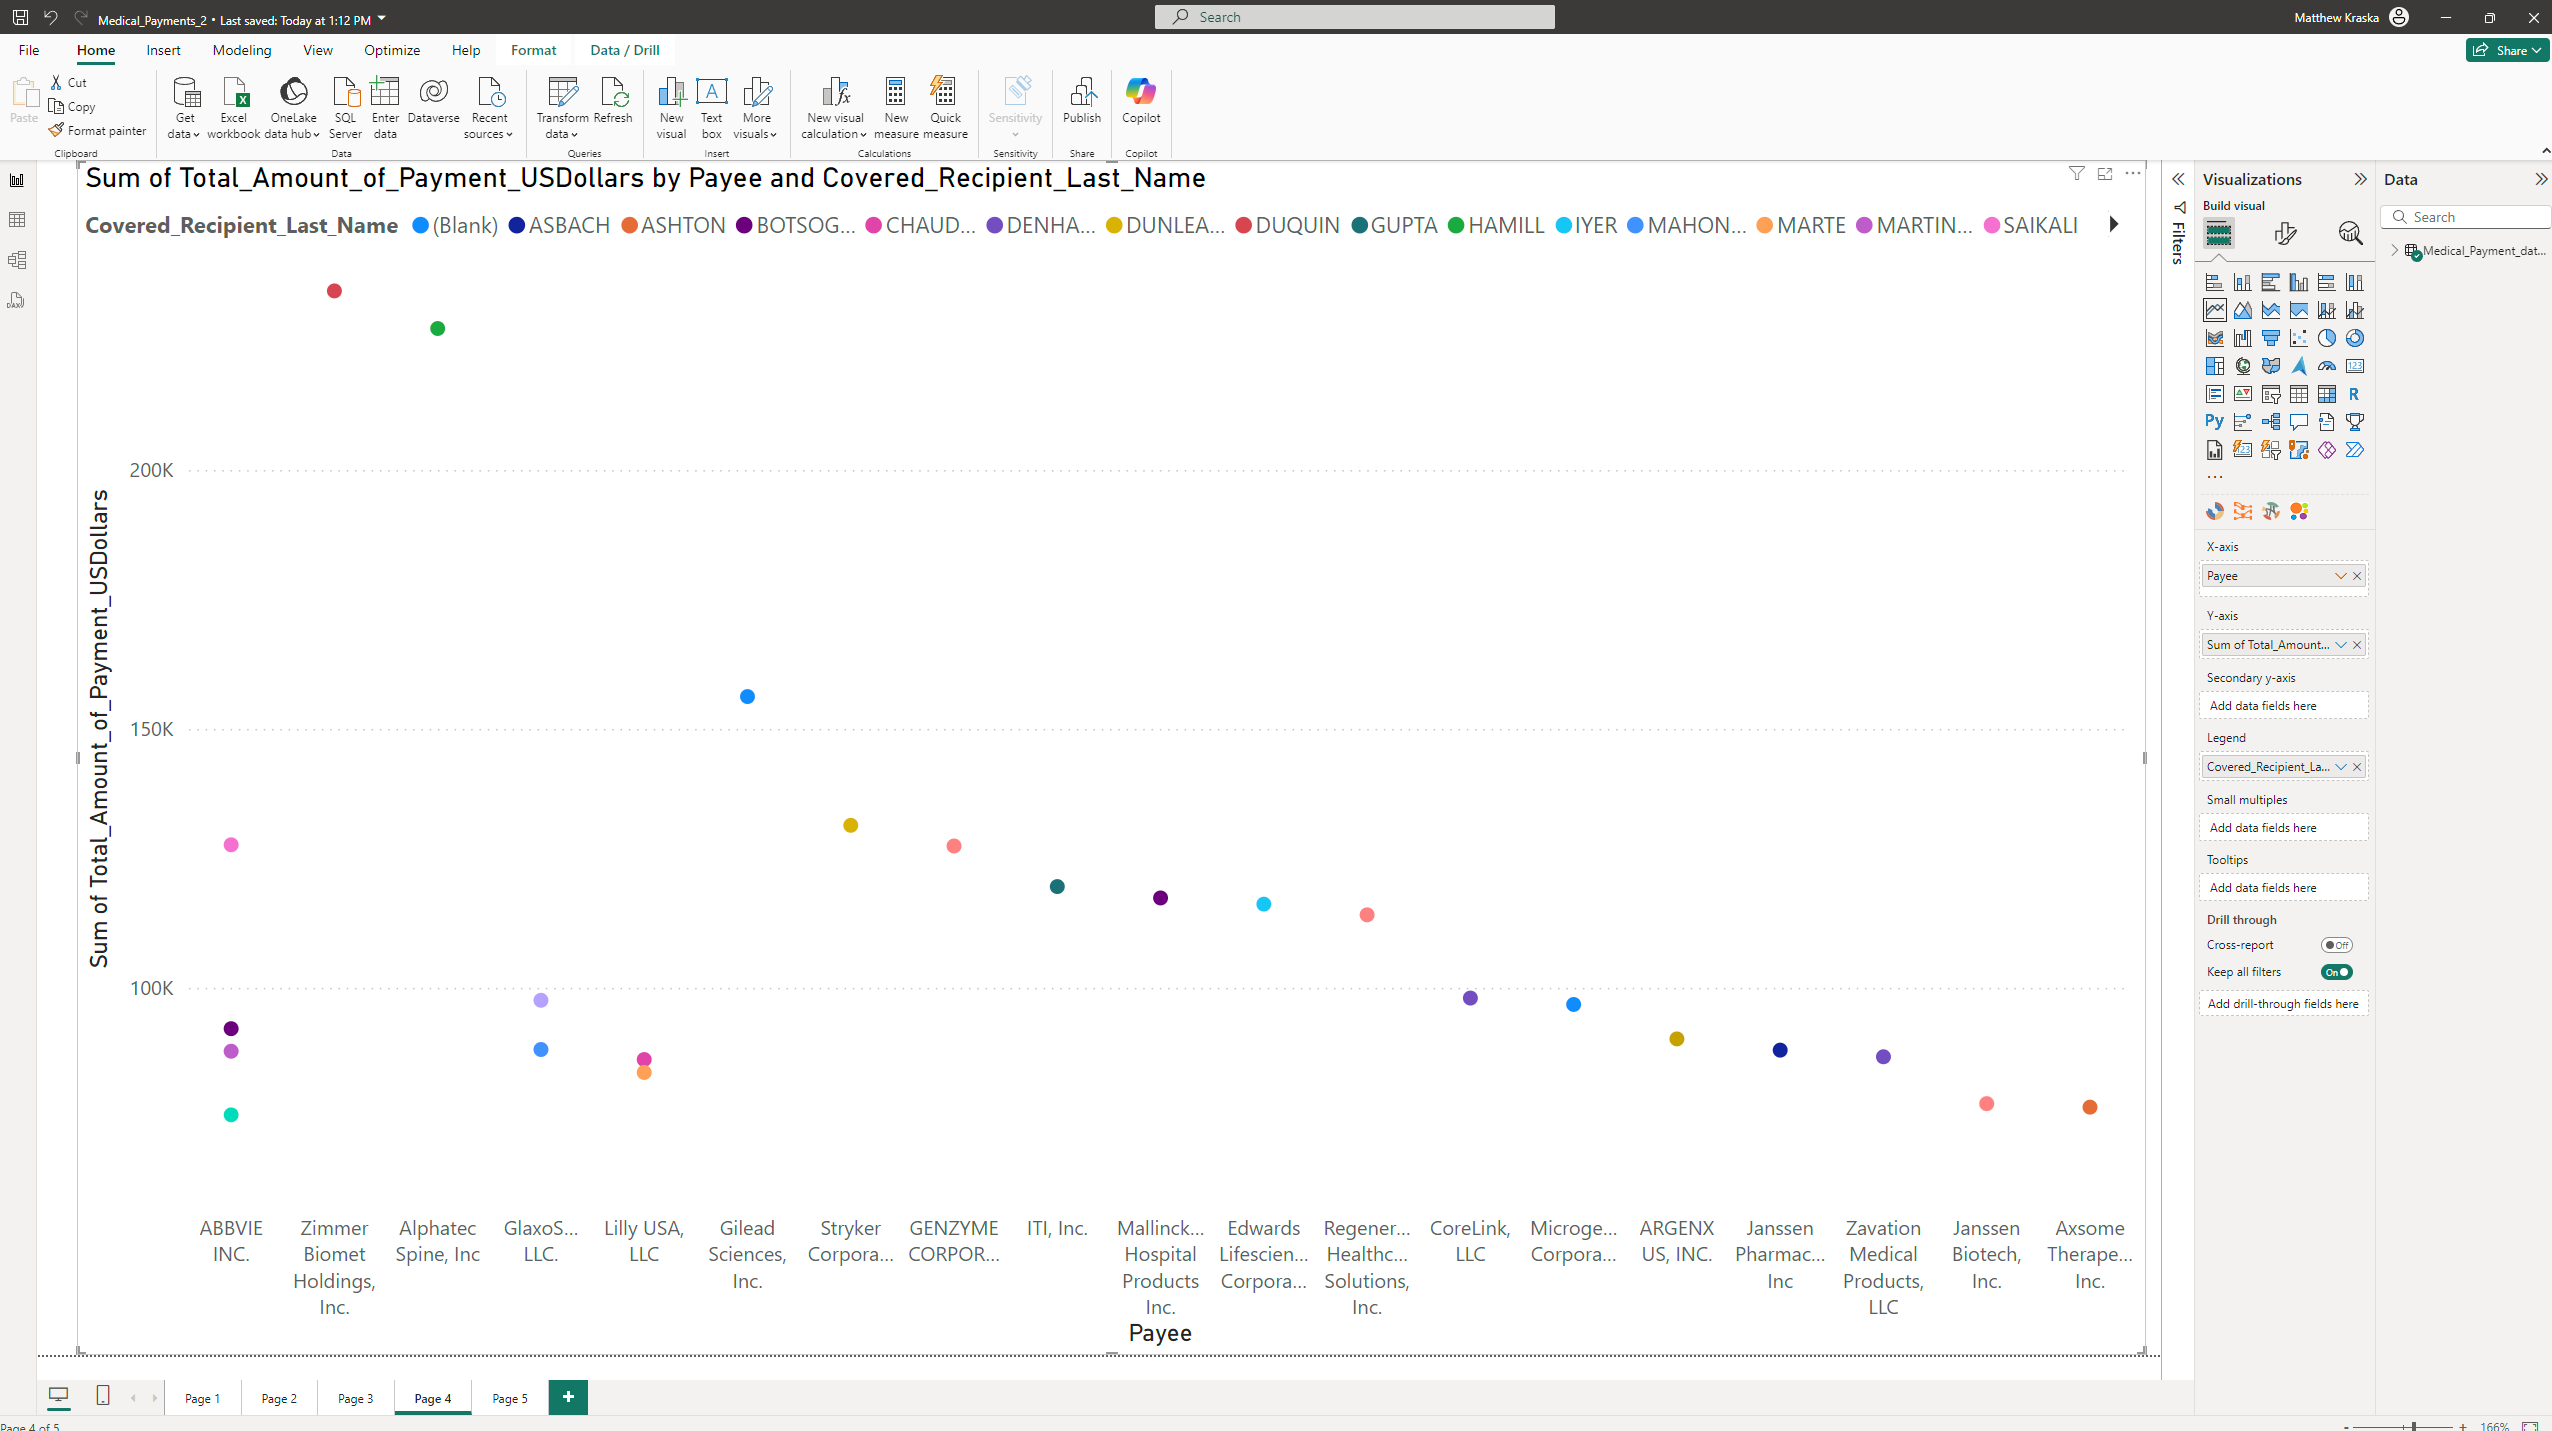
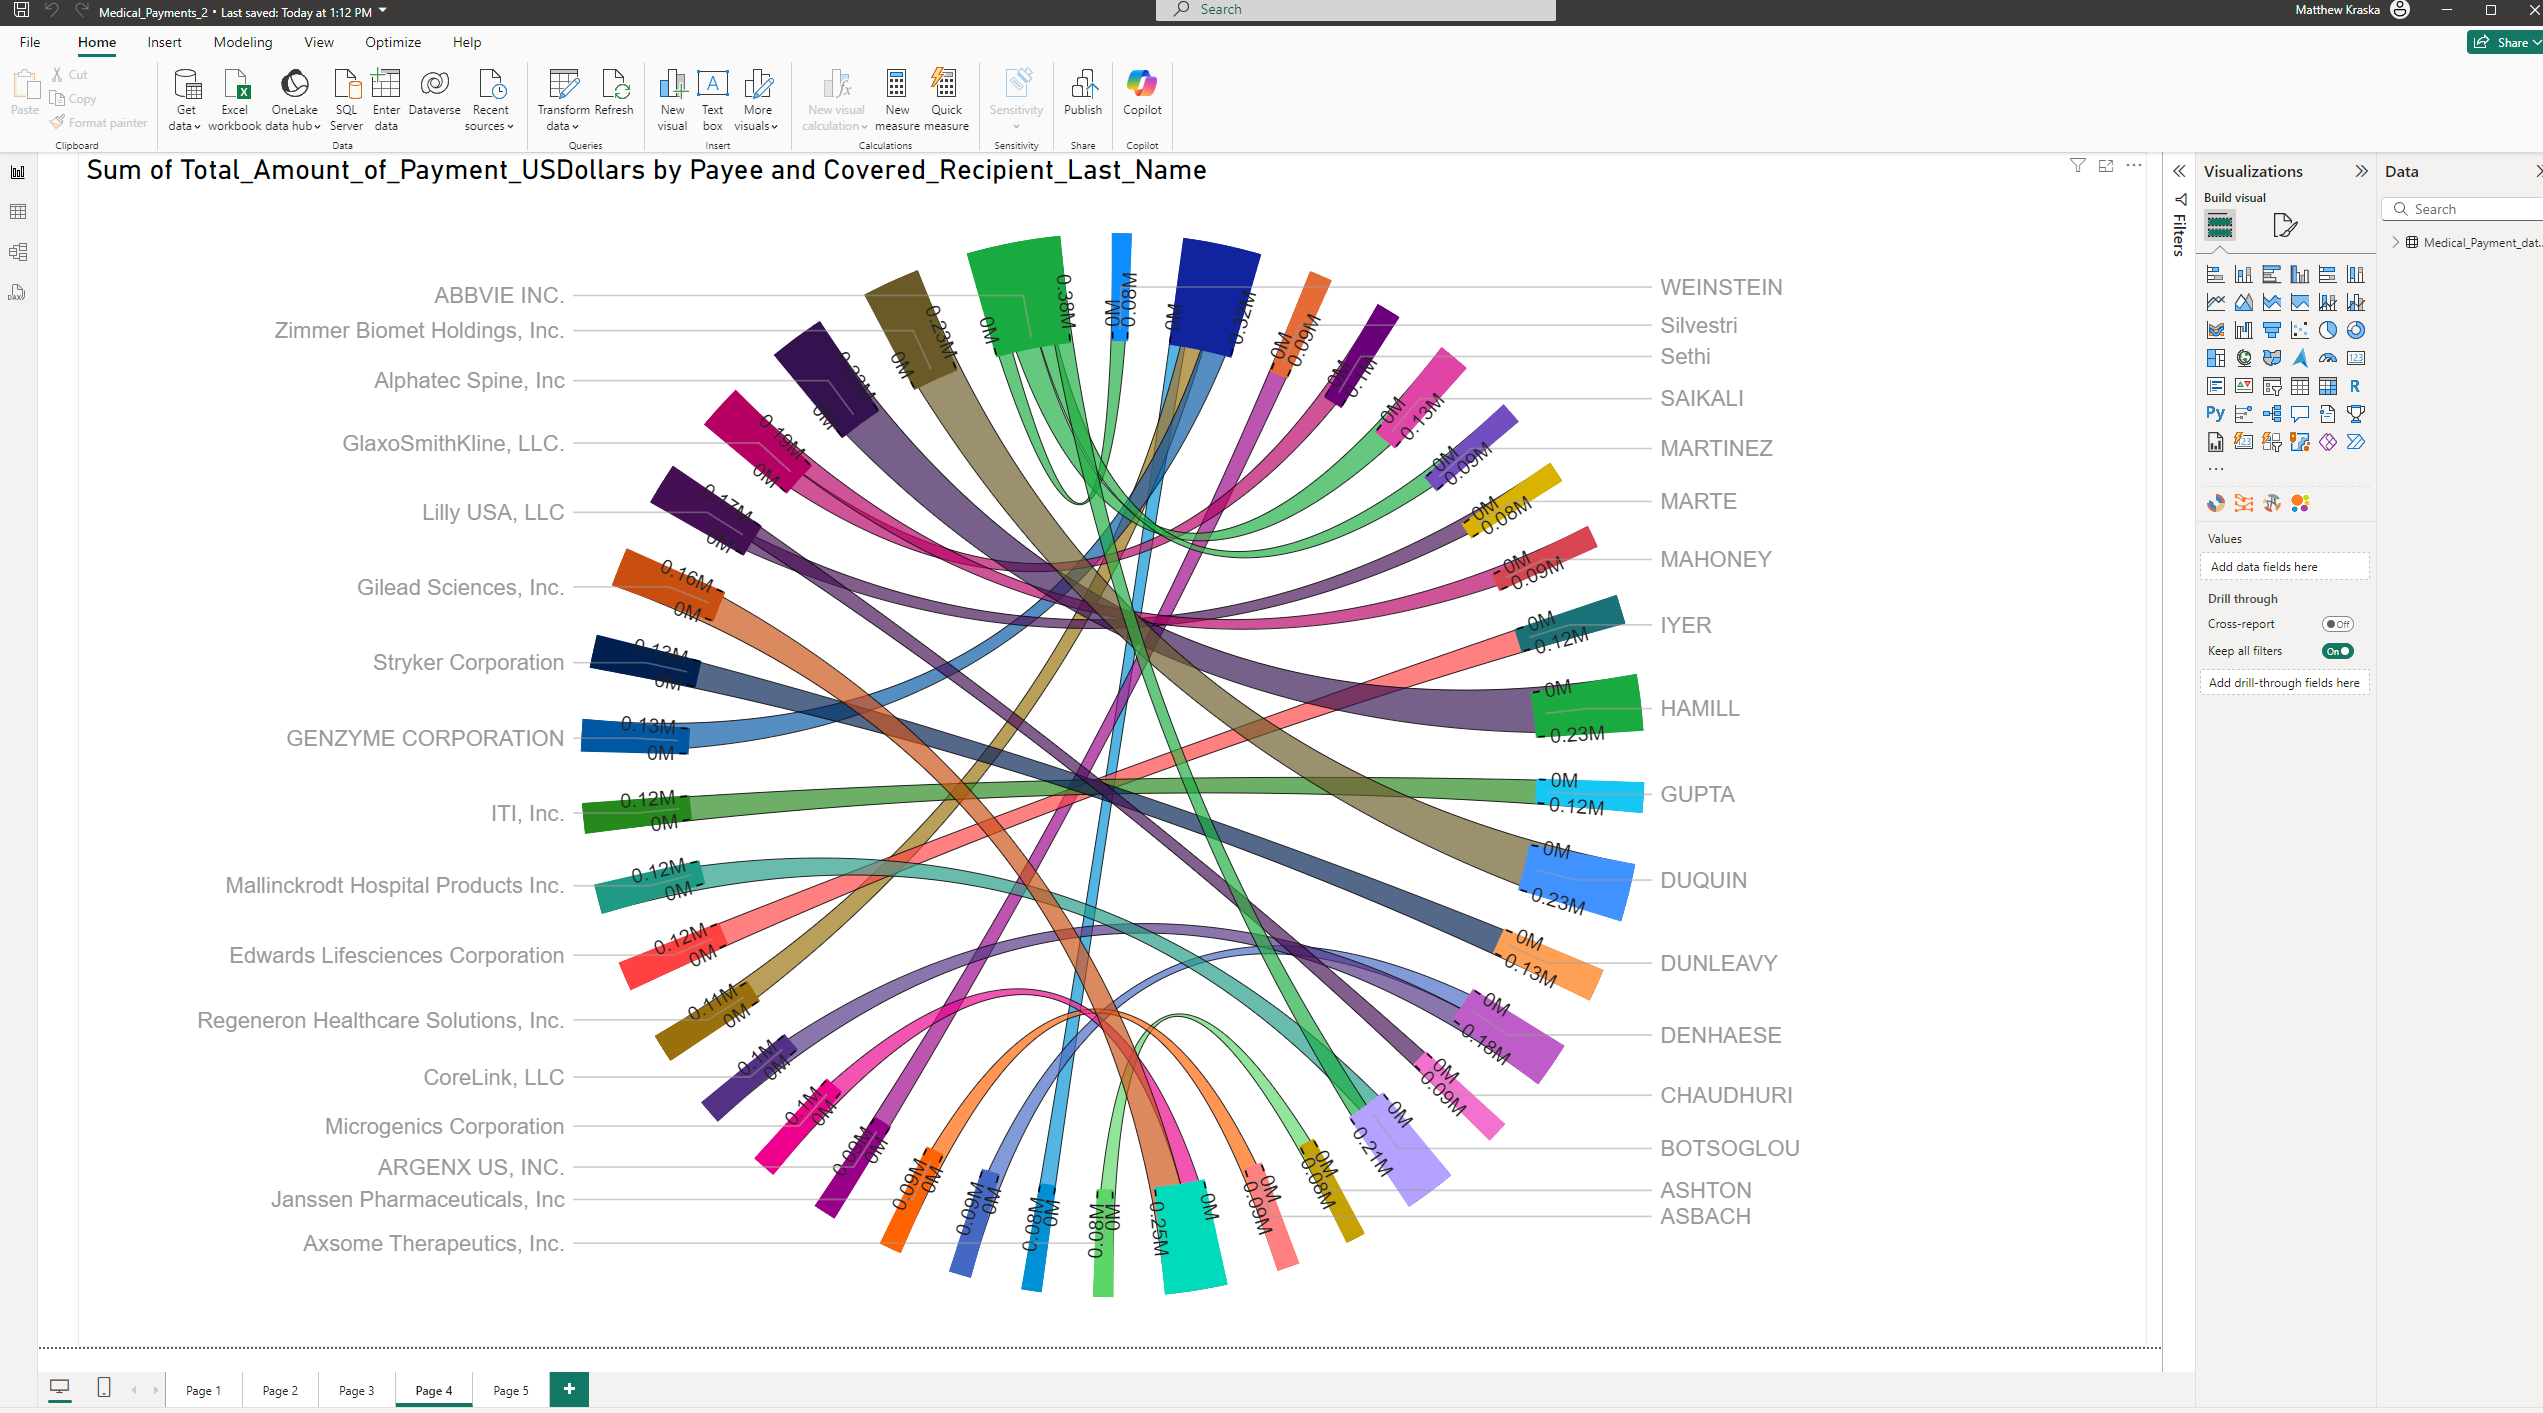
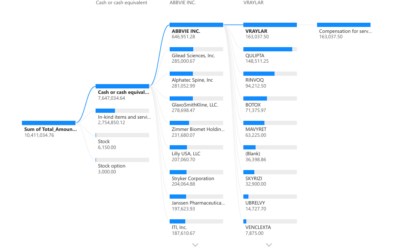
A PowerBI dashboard can be a little more intimidating than other options
Domo
Pros:
- Real-Time Analytics: Provides up-to-the-minute data insights.
- Scalability: Designed to handle big data from multiple sources efficiently.
- All-in-One Platform: Combines ETL (Extract, Transform, Load), data warehousing, and visualization.
- Collaboration and Sharing: Emphasizes social collaboration features within the platform.
Cons:
- Higher Price Point: This may be expensive for small businesses or startups.
- Complex Setup: Requires technical expertise for implementation and management.
- Feature Overload: This can overwhelm users needing only basic visualization.
Best Used When:
- Large enterprises need to integrate diverse data sources in real time.
- Organizations require a unified platform for data processing and visualization.
- Teams prioritize collaboration and have technical support to manage the system.
Selecting the right data visualization tool depends on your specific needs, resources, and the context in which you’ll use it.
- Excel is ideal for individuals or small teams needing straightforward data analysis without the need for advanced features.
- Zoho Analytics suits small to medium businesses seeking a cloud-based solution with robust collaboration and integration options.
- Power BI is best for organizations requiring advanced analytics and interactive dashboards and can invest in training.
- Domo is tailored for large enterprises that demand real-time data integration from multiple sources and a comprehensive BI solution.
Recommendations:
- For Quick and Simple Tasks: Choose Excel for its ease of use and familiarity.
- For Cloud-Based Collaboration: Opt for Zoho Analytics to facilitate teamwork and remote access.
- For Advanced Analytics Needs: Select Power BI to leverage sophisticated features and extensive data handling.
- For Enterprise-Level Solutions: Go with Domo when dealing with big data and requiring a full-scale BI platform.
By understanding each tool’s strengths and limitations, you can make an informed decision that aligns with your data visualization goals and organizational requirements.

